Restaurant Food Cost Percentage: How to Calculate It and Find the Leaks
Calculate your restaurant food cost percentage, see what NRA medians really measure, and find the gap between theoretical and actual cost.
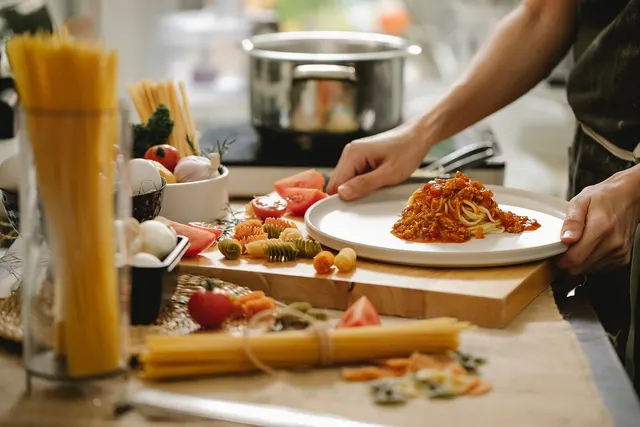
Photo: Pixabay
On this page 7 sections
- How to Calculate Restaurant Food Cost Percentage
- What the NRA Food Cost Benchmarks Actually Measure
- A Lower Food Cost Percentage Can Mean Less Profit
- Theoretical vs. Actual Food Cost
- Menu Problem or Kitchen Problem? Read the Two Numbers Together
- Fixes Matched to What the Variance Shows
- Start With Four Weekly Counts and Your Top 10 Sellers
Key takeaways
- Add non-alcoholic beverage cost back in before you compare yourself with the NRA's 2024 medians of 32.0% (full-service) and 32.4% (limited-service).
- Use trimmed, usable cost for every protein. A tenderloin that yields 75% costs a third more per usable pound than the invoice shows.
- In an illustrative $1.5 million full-service restaurant, a 3.25-point food cost variance costs about twice the median year's pretax profit.
- Rank dishes by the dollars each plate earns, and use the percentage only to spot drift over time.
Your restaurant food cost percentage is the cost of the food you used in a period, divided by your food sales for the same period, times 100. Get "food used" from inventory counts, not from invoices alone. For comparison, the National Restaurant Association's 2025 Restaurant Operations Data Abstract reported 2024 medians of 32.0% of sales for full-service restaurants and 32.4% for limited-service. Those figures include non-alcoholic beverages, and the NRA says they aren't meant to be targets for any one restaurant.
On its own, the percentage tells you little. It gets useful when you put it next to what your recipes say you should have spent.
How to Calculate Restaurant Food Cost Percentage
Food cost % = (Beginning inventory + Purchases − Ending inventory) ÷ Food sales × 100
The part in parentheses is your cost of food used. Every number in the formula has to cover the same period. If you go by invoices alone, the result swings. A big Friday delivery makes one week look terrible and the next week look great, even though nothing changed in the kitchen. Counting the shelves at the start and end of the period removes that swing.
One Week, Start to Finish (Illustrative)
Assumptions: counts are taken Monday morning before deliveries arrive. Food sales are measured after discounts and comps but before tax and tips. Alcohol is left out of both cost and sales.
| Line | Amount |
|---|---|
| Beginning food inventory (Monday open) | $8,000 |
| Food purchases during the week | $12,000 |
| Ending food inventory (next Monday open) | $7,500 |
| Cost of food used | $12,500 |
| Food sales for the week | $40,000 |
| Food cost percentage | 31.25% |
Count Rules That Keep the Number Honest
- Keep alcohol out. Bar purchases go in their own cost categories, because mixing bar cost into food hides problems on both sides.
- Fix one definition of food sales (net of discounts and comps, before tax and tips) and don't change it midyear.
- Count at the same hour every week, before the delivery truck arrives and before prep starts.
- Use the units you cost recipes in. If a recipe is costed by the pound, count by the pound, not by "half a case."
- Pick one treatment for staff meals. You can log them separately or leave them in food cost, but switching back and forth makes weeks impossible to compare.
Food cost is half of what operators call prime cost. Labor is the other half, and our guide to calculating and cutting restaurant labor cost percentage covers that side.
What the NRA Food Cost Benchmarks Actually Measure
The most-quoted benchmarks come from the NRA's Restaurant Operations Data Abstract. The NRA released the 2025 edition on August 20, 2025. It draws on financial data from more than 900 restaurants. The NRA's summary of the food cost findings puts the 2024 median at 32.0% of sales for full-service respondents and 32.4% for limited-service. The full-service figure is below the 34% average of the three previous editions. The NRA offers possible reasons: menus that are still more streamlined than before the pandemic, and a bigger share of full-service sales going off-premises.
Size mattered too. A separate NRA analysis found a median of 31.0% for full-service restaurants with $2 million or more in annual sales, against 33.7% for those below $2 million. The gap showed up in profit as well. Median income before taxes was 4.3% of sales for the larger group and 1.1% for the smaller one.
Two details change how you should read those numbers:
- The NRA counts food and non-alcoholic beverage costs together. If you track soft drinks, coffee and tea separately, add them back before you compare yourself with the median.
- The figures describe what operators reported. They aren't goals. The NRA's usage note says the Abstract isn't intended to set standards or goals for individual restaurants. A median blends steakhouses with pizzerias.
Check the denominator of any benchmark you borrow. Some reports divide food cost by total sales, others by food sales only. The NRA's public summaries say only "of sales," so confirm the definition in the full Abstract before you compare. Here is why it matters, using illustrative numbers. Take the $12,500 food cost and $40,000 food sales above and add $20,000 in liquor sales. Divided by food sales, food cost is 31.25%. Divided by total sales, it is 20.8%. The kitchen and the waste are identical. The second number looks better only because bar revenue grew the denominator.
Your concept matters more than any median. Menus built on premium proteins run higher because guests won't accept a steep markup on a ribeye. Menus built on dough and espresso run lower. Bars often price food to keep guests drinking, which deliberately keeps their food percentage low.
A Lower Food Cost Percentage Can Mean Less Profit
Chasing the lowest percentage is a common menu-costing mistake. Guests pay in dollars, and so does your landlord.
Take two illustrative plates. A burger costs $3.45 to make and sells for $14. That's a 24.6% food cost, and it leaves $10.55. Steak frites costs $13.60 and sells for $34. That's a 40% food cost, and it leaves $20.40. Every guest who orders the steak instead of the burger raises your food cost percentage and adds $9.85 to gross profit. If the steak takes no more line time than the burger, it's the better plate to sell.
So judge each item by its dollar contribution (price minus plate cost), then check how much labor it takes. Use the percentage to spot drift over time, not to rank dishes.
Theoretical vs. Actual Food Cost
Actual food cost is what the inventory formula gives you: the food that really left the building. Theoretical food cost is what you would have spent if every item sold had been made exactly to recipe, with no waste.
Theoretical food cost % = Sum of (plate cost × quantity sold) ÷ Food sales × 100
The gap between the two is your variance, and it shows where the money is going.
Build Plate Costs With Yield Built In
A spreadsheet works fine as a plate cost calculator. Give each ingredient a row with its invoice price, yield percentage, cost per usable unit, portion and line cost. Yield is the usable weight after trimming and cooking loss, divided by the purchased weight. Cost per usable unit is the invoice price per unit divided by yield.
Yield is the step people skip, and it's where plate costs go most wrong. As an illustration, say whole tenderloin costs $16.00 a pound and trims to 75% usable meat. Each usable pound then costs $21.33, so an 8-ounce filet costs $10.67 in meat, not the $8.00 the invoice suggests. Price that filet on $8.00 and every one you sell earns less than you think.
| Cheeseburger ingredient (illustrative) | Portion | Cost |
|---|---|---|
| Ground beef patty | 6 oz | $1.65 |
| Brioche bun | 1 | $0.55 |
| American cheese | 2 slices | $0.30 |
| Lettuce, tomato, onion | Standard build | $0.25 |
| House sauce | 1 oz | $0.15 |
| Fries | 5 oz | $0.45 |
| Fry oil allowance | Per plate | $0.10 |
| Plate cost | $3.45 |
Small costs add up as well. Butter on the flat-top costs money even though no recipe card lists it. Modifiers such as "add bacon" need their own cost and price in the POS. To-go containers belong either in takeout plate costs or on their own line. Re-cost your top sellers whenever a vendor price changes.
Pull Quantities From Your POS Product Mix Report
Your POS already knows what you sold. Most restaurant POS systems can export an item sales or product mix (PMIX) report for any date range, and that report supplies the quantities for the theoretical formula. Pull it for the same Monday-to-Monday window as your counts, and include voids and comps. A voided burger that was already cooked still used a patty.
What the Gap Is Worth (Illustrative)
Suppose theoretical cost for the week above is 28% and actual is 31.25%. The 3.25-point gap on $40,000 in food sales is $1,300 of food that left inventory without bringing in revenue. Some gap is normal, because trim and spoilage never reach zero. Watch the trend. A gap that widens week after week means something changed.
To see how that gap compares with profit, apply the same variance to a smaller restaurant. Take an illustrative full-service restaurant with $1.5 million in annual sales: $1.0 million from food and non-alcoholic beverages, the rest from the bar. At the 1.1% median pretax margin the NRA reported for full-service operators under $2 million, it earns about $16,500 a year before taxes. A 3.25-point variance on $1.0 million in food sales is $32,500 a year, roughly double that pretax profit. For a restaurant this size, closing the variance can matter more than any other line on the P&L.
Then drill down to single ingredients. Say the PMIX shows 400 chicken sandwiches and 150 chicken salads, each with 5 ounces of usable chicken. You should have used 2,750 ounces, or about 172 pounds. If your counts show 215 pounds used after yield, you used 25% more chicken than your sales justify. That 43-pound gap is the first place to look.
Menu Problem or Kitchen Problem? Read the Two Numbers Together
Theoretical and actual cost answer different questions, so compare them before you decide what to fix.
| What you see | What it means | Fix first |
|---|---|---|
| Theoretical above your target | Prices or recipes are off; a perfect kitchen would still miss | Reprice or re-spec the items that earn the least per plate |
| Theoretical on target, actual well above | Execution: portions, waste, receiving, or plates never rung in | Portion tools and a waste log |
| Both on target, profit still thin | Food isn't the problem | Labor, occupancy and the other cost lines |
For a menu problem, work backward from your target: menu price = plate cost ÷ target food cost %. Say beef prices push the burger's plate cost to an illustrative $3.95. Holding a 25% target means charging $15.80. If that price won't sell, change the recipe instead.
If both numbers are on target and the margin is still thin, check card processing next. Our practical guide to restaurant payment processing explains how those fees are built. MannyPay works with restaurants and bars on POS systems and card terminals. It also offers cost programs such as cash discount pricing, which has to be properly disclosed to guests.
Fixes Matched to What the Variance Shows
When one protein is off and everything else looks fine, suspect portioning or theft on that item. Put scales and portion cups at the stations that handle it. Pre-portion during prep so the line grabs a bag instead of eyeballing it, and spot-weigh a few plates each shift.
Produce that runs high week after week usually means over-ordering and spoilage. Keep a waste log at each station (item, quantity, reason, initials). Review it alongside the weekly variance to decide which prep pars to cut. If the same pan of rice gets thrown out every Tuesday, prep less on Tuesday. Rotate stock first in, first out, with date labels that meet your local health code.
Spikes on particular shifts often come from plates that leave the kitchen without being rung in. Kitchen display screens, or tickets that print only from the POS, close that gap. Our restaurant opening and closing checklist for FOH and BOH builds counts into daily routines.
A slow climb across every category usually means vendor price increases never made it into your plate costs. Check each delivery against its invoice for weight and count before you sign, and ask for credits on short deliveries the same day. Track prices on your biggest-spend ingredients so the next increase shows up in your recipes the week it happens. On the sales side, steer guests toward the plates that earn the most dollars. Server suggestions help, and so do any self-order kiosks you run.
Food trucks run the same math with less room for error. Storage is tight and restocking goes through the commissary, so over-ordering turns into waste fast. Count at the commissary at the same point each week, keep the menu short, and set pars from each location's event-day sales history. A food truck POS that reports item sales by location makes those pars much easier to set.
Start With Four Weekly Counts and Your Top 10 Sellers
For the next four weeks, count inventory at the same hour every Monday. Plate-cost your 10 best-selling items with yield included. Pull a PMIX report for the same windows and calculate theoretical against actual each week. Fix only the largest variance first, and once it closes, move to the next one. Four weeks of counts taken the same way will tell you more than any industry median.
Sources
- National Restaurant Association: Restaurant Operators Kept Food Cost Ratios in Check in 2024
- National Restaurant Association: Higher Volume Restaurants Reported Lower Food-Cost Ratios in 2024
- National Restaurant Association: Restaurant Labor Costs Are Well Above Historical Averages (Abstract usage note)
- National Restaurant Association press release: New Resource Provides Insights Into Operational Realities (August 20, 2025)
This article is for general educational purposes and is not legal, tax or financial advice. Card network rules and state laws change; confirm current requirements for your business.